What Is a Gantt Chart Used For? 10 Real-World Examples by Industry
What is a Gantt chart used for? Explore 10 industry-specific examples that show how Gantt charts improve project planning, scheduling, and tracking.
Gantt charts are a cornerstone of modern project management. Whether you’re overseeing a complex infrastructure rollout or managing a simple content calendar, Gantt charts help ensure no task falls through the cracks. This guide explores not just what a Gantt chart is, but dives deep into how it’s applied across 10 major industries—making it the ultimate resource for project planners looking to visualize their workflows better.
🔄 Bonus: If you’re still manually building timelines in Excel or struggling with MS Project, upload your file here and convert it into a sleek Gantt chart instantly using our free web tool.
What Is a Gantt Chart?
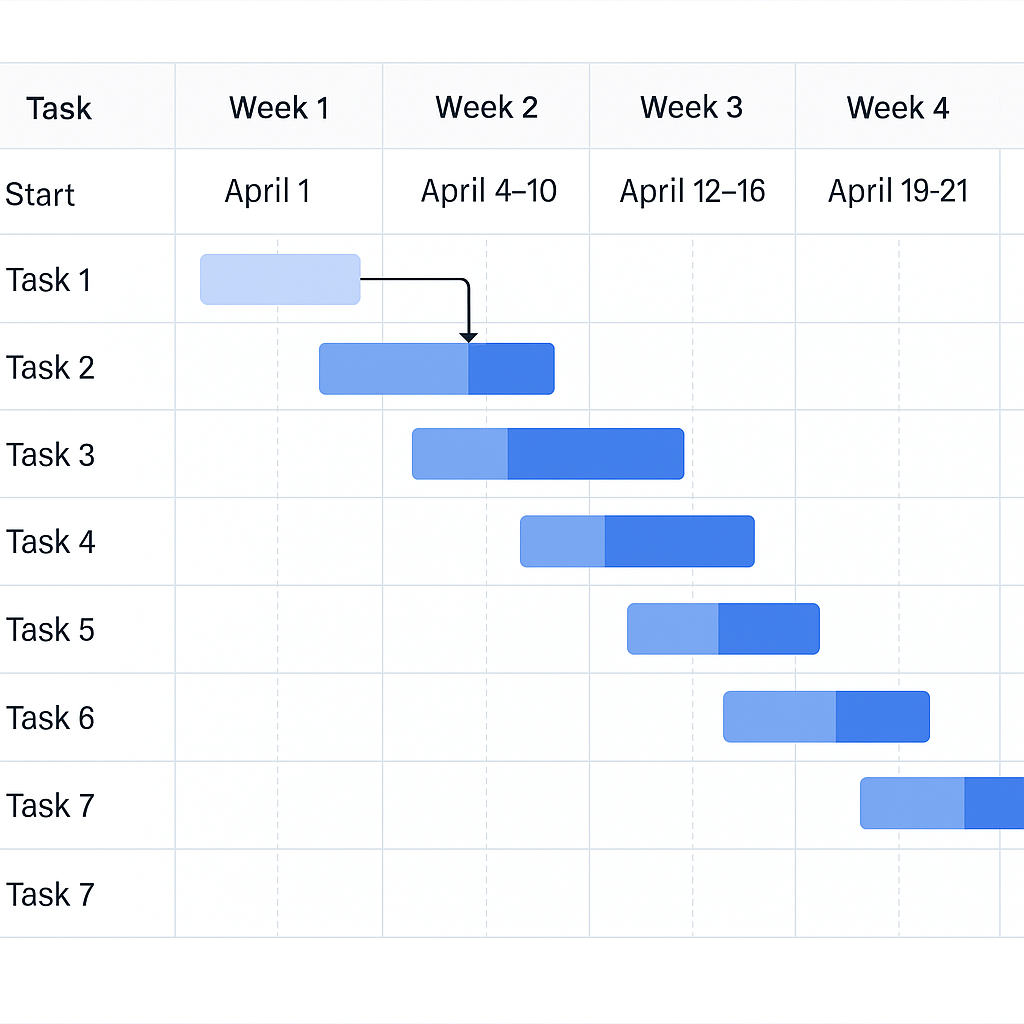
A Gantt chart is a horizontal bar chart used to illustrate a project schedule. Each task is represented as a horizontal bar, and its position and length reflect the start date, duration, and end date of the task.
🔑 Key Components:
- Tasks or activities
- Start and end dates
- Durations
- Dependencies (task relationships)
- Milestones
- Progress indicators or percent completion
Gantt charts were introduced by Henry Gantt in the early 1900s and are now a staple in both Agile and traditional project environments.
📊 Example: A project to build a website might include tasks like “Wireframing,” “Development,” “QA Testing,” and “Launch,” each laid out along a timeline.
Why Use a Gantt Chart?
Gantt charts are more than pretty visuals—they’re a strategic asset in project execution. Here’s why top-performing teams swear by them:
🎯 1. Clear Project Timeline
- Get a big-picture view of project scope
- Identify start and end points at a glance
🤝 2. Improved Team Coordination
- Assign tasks with clear deadlines
- Avoid overlaps and task ambiguity
⚠️ 3. Identify Bottlenecks Early
- See which tasks depend on others
- Prevent delays from cascading
📈 4. Monitor Progress
- Use percent-complete indicators to track real-time status
- Compare actual progress to the original plan
🧭 5. Stakeholder Communication
- Shareable visuals improve reporting
- Helps non-technical audiences understand project stages
Gantt Chart Use Cases by Industry
Below are 10 industries where Gantt charts play a crucial role—complete with real-life project examples to inspire your planning.
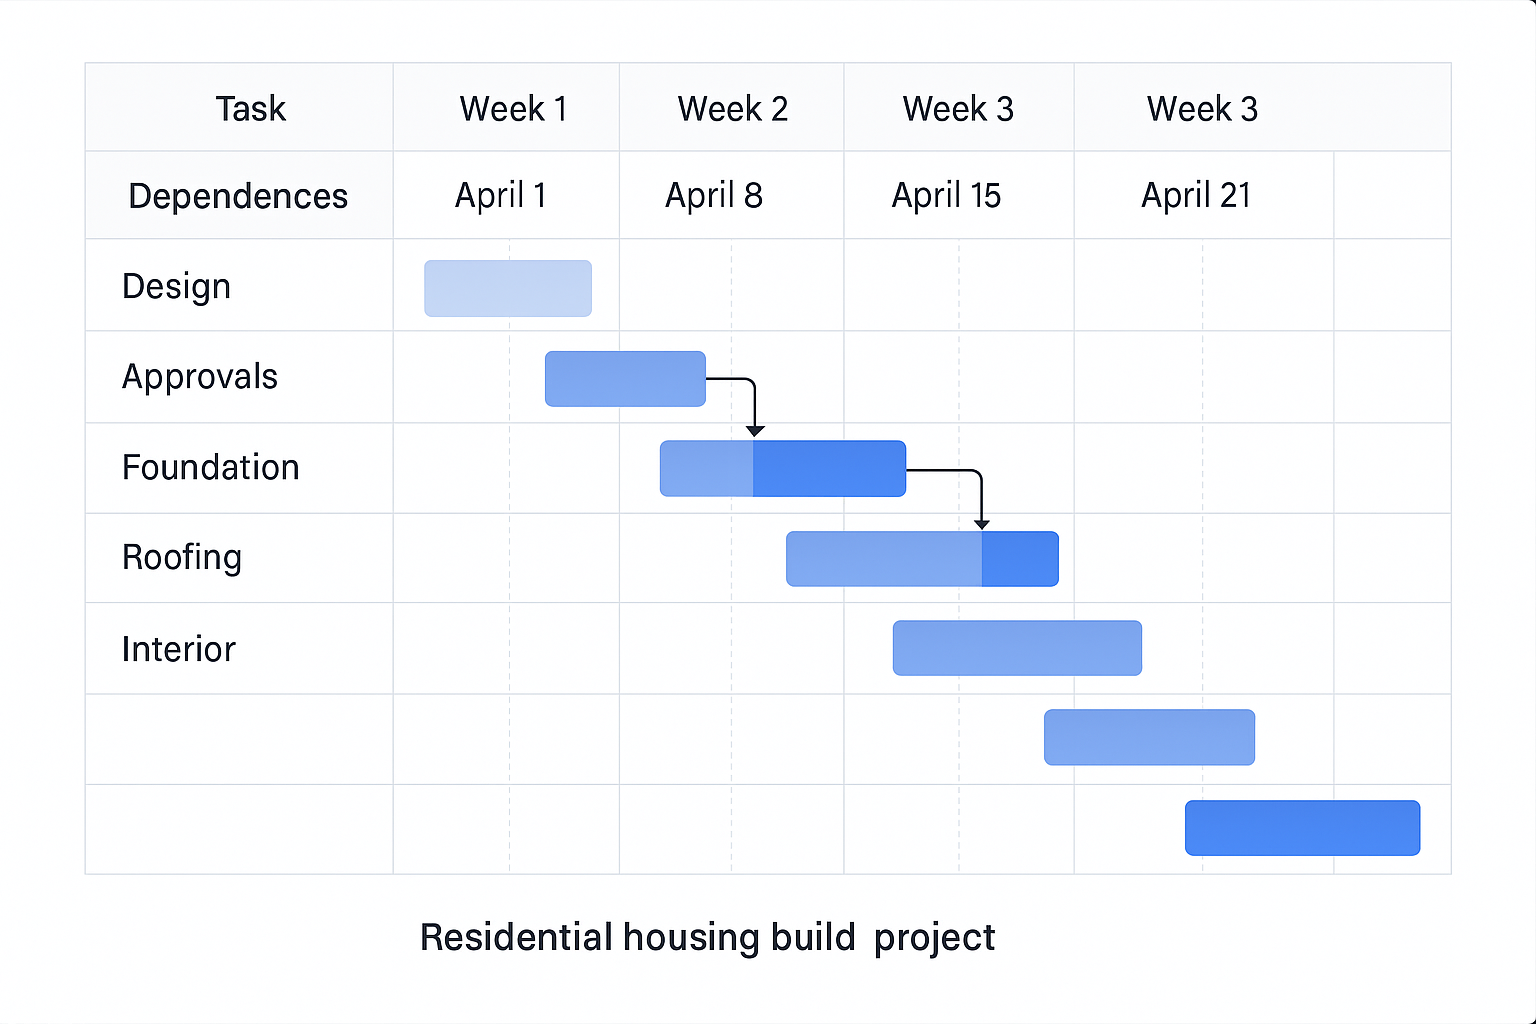
🏗️ 1. Construction
Construction projects involve many phases—permits, procurement, labor, inspections—and multiple teams.
Use Case Example:
- Project: Residential housing build
- Tasks: Design → Approvals → Foundation → Framing → Roofing → Interior
- Dependencies: Roofing starts after framing; inspections after each stage
🛠️ Bonus: Gantt charts in construction help coordinate subcontractors, avoid equipment downtime, and keep projects aligned with permit deadlines.
💻 2. IT & Software Development
Even Agile teams benefit from Gantt views to complement Scrum boards and sprint logs.
Use Case Example:
- Project: Mobile App Development
- Tasks: Requirements → UI/UX → Backend Dev → API Integration → QA → Deployment
- Dependencies: QA can’t start until development is done
📌 Many project managers use hybrid Agile models, where Gantt charts help track phases across multiple sprints.
📢 3. Marketing
Campaigns often span content, paid ads, video production, and social media—all needing alignment.
Use Case Example:
- Project: Product Launch
- Tasks: Ad Design → Landing Page → Email Drip Campaign → PR Outreach
- Dependencies: Emails can’t launch before the landing page is live
💡 Marketing timelines benefit from Gantt charts because they help align internal teams and external vendors.
🎉 4. Event Planning
From weddings to conferences, events rely heavily on scheduling and vendor coordination.
Use Case Example:
- Project: Tech Conference
- Tasks: Venue Booking → AV Setup → Registration → Speaker Lineup → Catering
- Dependencies: Catering and AV depend on venue availability
🗓️ You can reuse and adjust Gantt templates for recurring annual events.
🏭 5. Manufacturing
Manufacturers use Gantt charts to plan inventory, workforce, machinery usage, and batch scheduling.
Use Case Example:
- Project: Furniture Production Line
- Tasks: Material Procurement → Cutting → Assembly → Finishing → Packaging
- Dependencies: Packaging depends on successful QA checks
⚙️ Tracking production across shifts and machines reduces resource clashes and increases throughput.
🏥 6. Healthcare
Healthcare institutions manage capital projects, software rollouts, and training programs using Gantt charts.
Use Case Example:
- Project: Hospital Renovation
- Tasks: Demolition → Rewiring → HVAC Installation → Inspections
- Dependencies: Inspection clears the way for patient re-entry
🧬 Medical device installations and software onboarding are other Gantt-friendly projects in healthcare.
🎓 7. Education
Gantt charts help in curriculum rollout, construction of new buildings, and academic program development.
Use Case Example:
- Project: New Online Course Launch
- Tasks: Syllabus Design → Video Recording → LMS Integration → Enrollment Drive
- Dependencies: Enrollment begins only after platform setup
📚 Gantt views can be used at the department level or by university administrators managing large initiatives.
📡 8. Telecommunications
Telecom providers like FLOW or Caban Systems use Gantt charts for infrastructure upgrades and service rollout.
Use Case Example:
- Project: Islandwide Cell Site Maintenance
- Tasks: Line Inspection → Bushing/Vegetation Clearing → Pole Upgrades → Signal Testing
- Dependencies: Bushing must occur before pole work begins
🛰️ Gantt charts help plan work by location, assign crews, and track vendor progress in the field.
🌾 9. Agriculture
Farm managers use Gantt charts to plan crop cycles, irrigation schedules, harvesting, and logistics.
Use Case Example:
- Project: 3-Season Crop Plan
- Tasks: Soil Prep → Planting → Fertilization → Harvest → Delivery
- Dependencies: Harvest dates are tightly linked to planting schedules
🪴 Using Gantt charts helps optimize the use of land, labor, and equipment for better yield.
🚛 10. Transportation & Logistics
Whether moving goods or managing a fleet, logistics requires high-precision scheduling.
Use Case Example:
- Project: Holiday Delivery Rollout
- Tasks: Route Planning → Driver Assignments → Vehicle Inspection → Delivery Execution
- Dependencies: Routes can’t be dispatched until inspections are complete
🚚 For companies like JMD Transport, this is key to minimizing downtime and ensuring customer satisfaction.
How to Easily Create a Gantt Chart
You can build a Gantt chart in Excel or Microsoft Project—but it can be tedious. Between formulas, formatting, and lack of automation, these traditional tools can slow you down.
😩 Common Issues with Manual Gantt Charts:
- Excel: No built-in Gantt chart function, high risk of formatting errors
- MS Project: Expensive, requires training, and hard to share
- Updates: Any changes mean manual rework
✅ The Solution: Automated Gantt Charts from Your Existing Files
Our web tool allows you to upload .xlsx or .mpp files and get an instant, professional Gantt chart—no design skills or software licenses needed.
🛠️ Try it now → Convert your file
Conclusion
Gantt charts are powerful, visual tools that help plan and track projects in every industry—from software to farming. By offering a clear roadmap of what’s happening and when, they keep teams focused, stakeholders informed, and deadlines on track.
Whether you’re a project manager, small business owner, or freelancer—don’t waste time building Gantt charts manually.
👉 Upload your Excel or MPP file to our free tool and get your Gantt chart in seconds.
Let your project planning become as efficient as your execution.